
An overview of the company providing information such as general business description, products/services overview, management overview, strategy, financial information, end markets, major customers, manufacturing plants/properties, geographic coverage, sales and profit mix, employees, deal rationale, headquarters, logo, share price history & other trading information, investment criteria, management bios, fund information etc.
Can be in different formats (eg. In MS Powerpoint, MS Word or as 1-Pager, Multi-Pager, Strip). Can be customized as per client internal formats or requirements.
Can be for different purposes (eg. For Buyers, Targets, General Companies, Financial Sponsors).

A comparison of various parameters of companies such as headquarters, employee count, financial information, description, management and any other major information.
Presented usually in MS Excel format.
Consists of company comparables and transaction comparables.
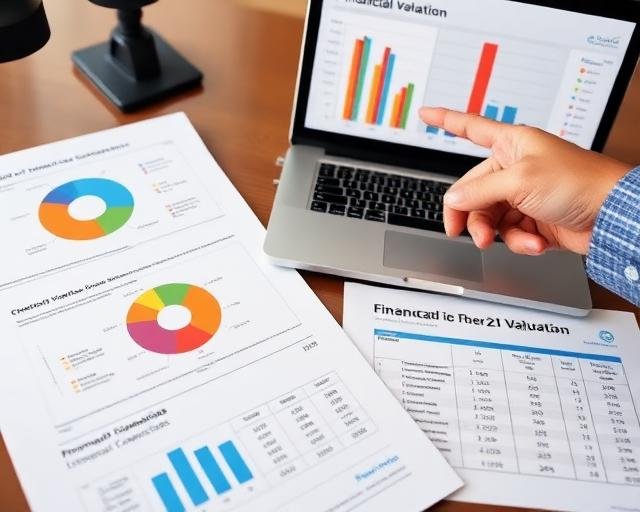
Company Comparables is a comparison of trading and other financial information of public companies. Contains information such as share price & other trading parameters; multi-period headline financials such as Revenue, EBITDA, EBIT/Operating Profit, Net Profit, EPS; debt information; options & other convertibles’ information; and preference capital. Presented in MS Excel format. Can include adjustments for non-operating/non-recurring items, M&A and capital issue/repayment activity. Used to derive average/median trading multiples for valuation.
Transaction Comparables is a comparison of multiples paid for various deals over a relevant period. Consists of information such as offer price, overall purchase price, recent & forecasted financials of the target, Enterprise Value, multiples paid etc. Presented in MS Excel format. Used to derive average multiples/median multiples paid for deals in a particular industry.
Consist of Discounted Cash Flow (DCF), Leveraged Buyout (LBO), Accretion-Dilution, WACC, forecast and other financial models.
Discounted Cash Flow is a financial model used to derive the intrinsic value of a company by discounting the forecasted cash flows (either to the company or to equity shareholders) and terminal values to the present time. Presented in MS Excel format.
Leveraged Buyout is a financial model used to assess the financials of a company as well as returns to the buyers in the event of a leveraged buyout transaction. Presented in MS Excel format.
Other financial models are built as per requirements such as calculating the accretion/dilution from a particular deal, calculating the cost of capital, and assessing the forecasted financials of a company.
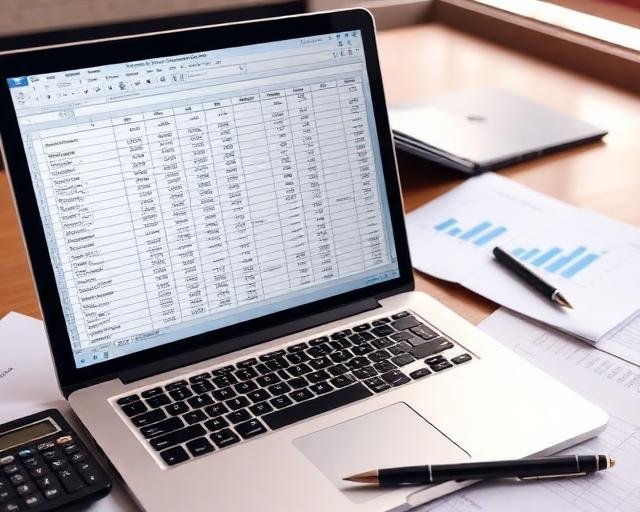
Consists of summarizing and analysis of data using MS Excel. Examples include summarizing the results of a survey and creating pivot tables.

Can include collation of information such as industry definition (including products & services), major players, market shares, historical & forecasted growth and other operating aspects of a particular industry. Can also include creation of MS Powerpoint slides to present relevant insights.

Can include research on various aspects of a company. Examples include information on operating facilities of a company, news on a company and information on management or founders of a company. Can be presented in multiple formats.

Can include screening of companies or transactions in various industries from different data sources. Screening of companies can include various criteria such as industry (eg. Food & Beverage industry), size (eg. Above $50mn in annual Revenue) and geographic location (eg. Headquartered in U.S. or Canada). Screening of transactions can include criteria such as deal size (eg. Deals above $100mn value), multiples (eg. Deals with disclosed multiples) etc. in addition to criteria in screening of companies.

Can include deliverables such as newsletters and market reports. Newsletters can include news runs of a particular set of companies in an industry or a general run of news in the industry. Market Reports can include commentary on relevant macro and sector trends, news on the sector (eg. Fundings secured by various companies and product launches), and output of trading multiples and share prices through tables and charts. Can be presented in MS Word or MS Powerpoint formats.

Can include information such as purchase price, premium paid, deal multiples, deal overview, buyer & target overview, financials, deal rationale, share price trends and other aspects relevant to a transaction. Can be presented in MS Powerpoint format.
We provide detailed business reports covering financials, management insights, market positioning, and performance analytics.